Tuesday, May 29, 2018

Texas Two-Stepping With 3 Public Frac Sand Companies

An earlier just-the-numbers analysis outlined the basics of five frac sand companies, but the sand landscape is literally and figuratively changing weekly, so investors will find an update useful. In particular, companies are expanding into a third geographic area; are confronting ferocious and expert competition from private sand companies as well as large turnkey companies; are experiencing both rail and truck transportation limits into the Permian; continue diversifying into non-Permian plays; are grappling with key safety and environmental regulations; and from an overall perspective, continue to deal with the major underlying factor: volatile oil prices affecting demand. In this environment, three sand-only public companies are adapting well and a fourth high-profile merger is about to list publicly.

The three companies are Hi-Crush LP (HCLP), Smart Sand (SND), and US Silica (SLCA). The merged companies are Fairmont Santrol and Unimin, which will go public June 1 as Covia with stock symbol CVIA.

Private-Company Sand Suppliers

A recent oilfield conference featured talks and displays by some of the following sand suppliers: Alpine Silica, Atlas Sand, Black Mountain Sand, High Roller Sand, Preferred Sands, Select Sands, Sierra Frac Sand, Superior Silica Sands, and Vista Proppants and Logistics. All are private except Select Sands, which trades on the OTC market.

Other Public Competitors, Bundled-Service Competitors, and Third- Derivative Companies

Two public sand/proppant-only companies catching up to competition are CARBOCeramics and Emerge Energy Services.

Three companies that bundle frac sand supply into their service suite are Halliburton (HAL), Mammoth Energy (TUSK), and Schlumberger (SLB). Notably, Halliburton blamed its first quarter 2018 loss on delays in transporting sand by rail from North Dakota to the Permian Basin. Mammoth Energy has three sand sub-divisions - Muskie, Piranha, Taylor - which each supply from different mines.

There are also companies serving the oil industry that specialize in sand inventory management - but don��t own mines - or in dust control. Investors can consider them ��third-derivative companies:�� in that the leading factor is oil price, the first derivative of which is oil demand, a second derivative is frac sand supply, and a third derivative is ancillary sand services.

Image result for map of major frac sand areas

Sand Mine Locations

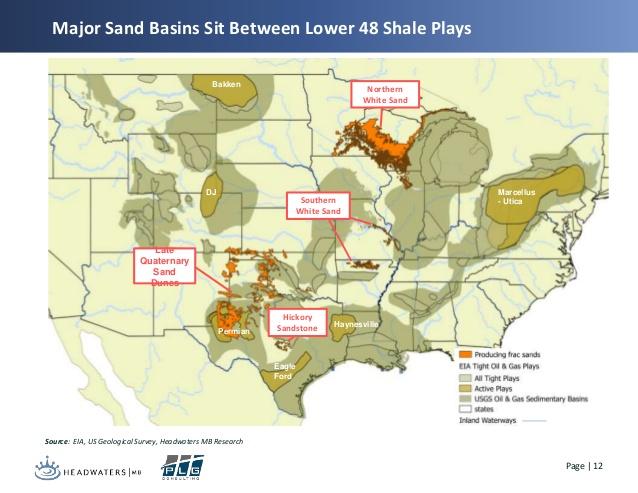
The biggest locations for frac sand mines have expanded from one to two to three. The first were the Northern White/��Wisconsin�� (really, Minnesota-Wisconsin-Northern Illinois) sand mines. They remain a potent force due to market penetration, reasonable cost, and performance of Northern White sand in fracturing.

But producers first exerted cost pressure and then saw better results by using larger volumes of sand, a second source was developed. These mines are in central Texas, shown above as ��Hickory Sandstone�� and their product is referred to ��regional sand,�� or ��Brady Brown.�� Due to their location, this sand doesn��t require as much long-haul rail freight cost or occasionally-fraught logistics. However, some producers have not been happy with its turbidity (cloudiness).

Finally, experienced oil field producers noticed potentially-usable sand within the Permian basin. Its quality is similar to Wisconsin sand and its location in Winkler County is roughly between the Midland and the Delaware sub-basins of the Permian. So it checks the quality and the no-rail transport boxes. This third region is referred to as ��in-basin�� or sometimes ��Winkler trend�� sand.

Smart Sand has one Wisconsin mine. Hi-Crush has four Wisconsin mines, including two dedicated to the Permian Basin, and one in-basin mine, open since 2017. US Silica has five Northern White mines, three regional mines, and two in-basin (Texas Permian) mines that were announced in September 2017.

Dunes Sagebrush Lizard And In-Basin Sand

Permian drillers generally, and companies developing in-basin sand avoid the habitat of the dunes sagebrush lizard: far southeast New Mexico and four nearby Texas counties. Rules protecting the lizard in the Texas Conservation Plan, as delegated from the US Fish and Wildlife Service, are currently being rewritten partly because they apply only to oil and gas companies. Two private sand companies, Black Mountain and Vista, have grandfathered properties and so would not be affected by any change in regulations, while a third, Atlas Sand, has been careful to keep its development away from the protected area. However, these limitations will restrict some development of in-basin sand mines.

Covia

Unimin, the largest (and formerly-private) sand company and Fairmont Santrol, the third largest, are combining their sand operations into a new NYMEX-listed company, Covia. Covia is expected to begin trading June 1, 2018. It will be the largest sand company, with 1.4 billion tons of reserves and 45 million tons per year of capacity. Had it been operating as a combined entity in 2017, its sand production would have been 36 million tons.

Oil Prices

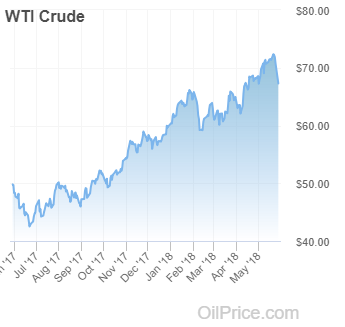
The May 24th closing oil price was $67.88 per barrel for West Texas Intermediate (WTI) crude oil, below recent highs on storage builds and news that Russian and Saudi Arabia plan to increase oil production.

The December 2018 NYMEX price is lower at $66.36 per barrel and the December 2019 NYMEX oil price is below that, at $61.31 per barrel. Lower oil prices and Permian transport limitations described below could reduce Permian oil drilling and thus the requirements for sand.

Sand Demand and Capacity Estimates

West Texas sand demand estimates range from 40-60 million tons per year, while Seaport Global estimates total demand of 100 million tons per year. Hi-Crush estimates 25-30 million tons per year of eight in-basin Permian mines will be available to the market this year.

Hi-Crush��s sand capacity is 13.4 million tons per year with 2017 production of 8.9 million tons. Smart Sand��s capacity is 3.3 million tons per year with 2017 production of 2.4 million tons. Including 9.5 million tons per year of capacity expansion, US Silica has 25 million tons per year of capacity for oil and gas proppant sand and in 2017 produced 15.1 million tons. Clearly, Covia will be the volume leader.

Permian Takeaway Limits

The huge increase in US production, to 10.7 million barrels per day (BPD), and within that Permian production, at 3.2 million BPD, has pushed all kinds of transportation to their limits in west Texas. The first is the broad limit on pipeline (and refining) takeaway capacity for oil, natural gas liquids, and natural gas. That is expected to be remedied by the end of 2019.

The second limit is trucking and truckers. There simply are not enough to haul the oil that can��t go into pipelines, fresh water that isn��t pipelined and recycled water. For example, in the last few months, the Permian region has added 70,000 BPD of oil production per month to the 3 million plus total. However, PLG Consulting estimates that if transported only by truck, just about half of that, or 40,000 BPD, requires 600 new truck drivers.

Specifically for sand, there is not enough trucking capacity (and roads) to either get regional sand from its Texas mine to the well-site or ��last-mile�� capacity to get Wisconsin sand from a Texas railroad terminal or in-basin sand from Winkler County to the well-site.

Indeed, companies go so far as to map congestion at specific intersections in small West Texas cities like Kermit and Monahans, try to spread their plant and terminal pick-ups throughout the day, and calculate the Texas Department of Transportation (TxDOT) weigh limits to the pound. For sand trucks in Texas the limit is 84,000 pounds; companies have discussed trying to get the limit raised to Colorado��s 93,000 pounds.

Finally, for Wisconsin sand, long-haul rail transportation has also been constrained, leading to delivery delays for sand from those mines. Along with Halliburton, Hi-Crush noted that such delays affected its first-quarter results.

Thus, supply from each source can have issues, although HCLP notes that its Texas rail terminals are closer to well-sites than even the in-basin sand in Winkler County. Again, Smart Sand has one Wisconsin mine, Hi-Crush has four Wisconsin mines and one in-basin mine, and US Silica has five Wisconsin mines, three regional brown mines and two in-basin mines.

Offsets To Permian Basin Congestion

In general, the closer a mine or a rail terminal is to Permian wellsites, the better, and each of these companies has one or both advantages for their mines. As the map below shows, basin diversification also helps: two of Hi-Crush��s four Wisconsin mines serve Marcellus-Utica (Appalachian) drilling and Smart Sand has a new North Dakota terminal allowing it to also serve the nearby North Dakota Bakken, as can the Northern White mines of Hi-Crush and US Silica.

Image result for map of major frac sand areas

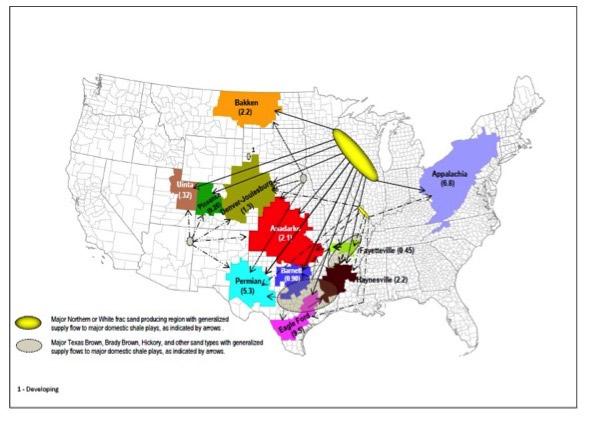
Credit: Rock Products, 2015 (Permian in-basin mines not shown)

New Silica Dust Regulation

In June 2018, new Occupational Safety and Health Agency (OSHA) regulations go into effect for sand, glass, construction, and ceramic workers�� exposure to silica dust. OSHA lowers the permissible exposure level (PEL) to 50 micrograms per cubic meter over an eight-hour time-weighted average. All workers exposed to sand at any location are covered, and it will apply to all who work with sand.

Nanoparticle or Nanoproppant Technology A Competitor?

Using nanoparticles or nanoproppant, which in their size and fluidity appear to resemble a fluid cracking (FCCU) catalyst, sounds like a potentially-appealing fracking technology based apparently on less water use and more surface area exposure than larger sand particles.

However, the technology falls prey to the marginal cost of fracking, or any process. Fracking is essentially putting one set of materials (sand, water) into the ground to extract another material (oil and other hydrocarbons). The economic prime directive is what drillers put into the ground cannot cost more than what they get out of the ground. The problem with nanoparticles, as with any manufactured proppant like resin-coated sand or ceramics, are their high cost relative to sand, especially when considering the millions of pounds required for hydraulic fracturing.

Moreover, nanoparticles, which some consider similar to very fine 200-mesh or 300-mesh sand (100-mesh and 40/70 mesh are used now), could easily add to the burden of complying with the dust regulations mentioned above.

Capitalization, Stock Price, And Current Vs. 52-week High

Based on May 25th, 2018 closing prices, US Silica has the largest market capitalization at $2.4 billion, followed by Hi-Crush at $1.2 billion and trailed by the much smaller Smart Sand at $250 million.

5/25

52-wk

Current

Symbol

Price

high

to high

HCLP Hi-Crush LP

13.15

14.85

89%

SLCA US Silica

30.93

39.21

79%

SND Smart Sand

6.09

11.06

55%

Current, Dividend, And Price-to-Earnings Ratios

The current ratio is the ratio of a company��s current assets to its current liabilities. A ratio of 1.0 is a minimum desired level: the current ratios for these three companies range from 1.6 to 4.6.

Smart Sand does not pay a dividend. US Silica��s $0.25/share provides a 0.8% yield and Hi-Crush LP��s $0.90/partnership unit gives a 6.8% return.

Hi-Crush has a price-to-earnings (P/E) ratio of 8; Smart Sand has a P/E of 11 and US Silica has a P/E of 17.

Liability-To-Asset And Short Ratios

The three companies have low liability-to-asset ratios, which suggest financial flexibility: Smart Sand is at 25%, Hi-Crush LP is 27% and US Silica is a steeper 41%.

The percentage of shares shorted, a measure of investor skepticism, is modest and similar for all three companies at 15-18%.

Limited Partnership Issue

Of the three companies, only Hi-Crush is a limited partnership. Investors should consider their individual tax position before investing.

EV/EBITDA Ratio And Return Ratios

EV/EBITDA ratio is the ratio of a company��s enterprise value divided by its earnings before interest, taxes, depreciation, and amortization. A ratio below 10 suggests a prospective investment and two of the companies are below or at the target: Hi-Crush at 7.2, US Silica at 9.1. Smart Sand is not far off at 10.6.

The companies have good returns on assets at 9.2% for Hi-Crush, 5.8% for US Silica, and 5.1% for Smart Sand. Returns on equity were a similarly solid 18.5% for Hi-Crush, 13.3% for US Silica, and 12.0% for Smart Sand.

Risks

Summarizing the risks that have been described: the biggest one is a fall in oil price that would reduce drilling incentives, with Permian basin inbound and outbound congestion across every factor (crude, natural gas, water, sand, and especially labor for fracturing, completion, and trucking) a close second. Long-haul rail constraints are another limitation, along with the sheer growth (and lack of roads) in the Permian. Finally, the sheer size of Covia could act to drive down sand prices.

Recommendations

Based on these numbers, potential investors are encouraged to consider investing in US Silica, Hi-Crush, and Smart Sand. Depending on investors�� individual tax situations and changes under the new law investors may want to consider Hi-Crush Limited Partnership for its high yield of 6.8% and its new in-basin mines.

US Silica continues with its large stable market cap, 100+ year history, solid returns and good diversification into industrial specialty products. And despite its small size, I also recommend Smart Sand given its attractively low debt level and upside to its one-year target. With its new North Dakota terminal Smart Sand can readily diversify its sales into the Bakken in addition to the Permian.

Finally, while a recommendation about new IPOs is beyond the scope of this analysis, investors may want to follow up on Covia, a new company resulting from the combination of Fairmont Santrol and Unimin.

Investors should consider factors in these three companies�� current operations, as well as their future earnings, strategies, and issues. These include a possible downturn in the crude oil market, fierce competition between sand suppliers, and any changes that reduce the use of sand in hydraulic fracturing.

While you're here, consider subscribing to Econ-Based Energy Investing, a Seeking Alpha Marketplace platform. Weekly in-depth articles provide you with recommendations for long energy investments.

Subscribers get actionable ideas, make decisions with larger industry context, and save time on research. My service focuses on publicly-traded small & mid-cap oil producers (by basin) & refiners (by area) drawing from a public energy space spanning more than 400 companies.

I��m an industry insider with +30 years' experience working for & investing in energy companies. As you plan your research and investing strategies for the year, consider Econ-Based Energy Investing.

Disclosure: I am/we are long TUSK.

I wrote this article myself, and it expresses my own opinions. I am not receiving compensation for it (other than from Seeking Alpha). I have no business relationship with any company whose stock is mentioned in this article.

Friday, May 25, 2018

Investors Buy Shares of Pfizer (PFE) on Weakness

Traders purchased shares of Pfizer Inc. (NYSE:PFE) on weakness during trading on Thursday. $142.15 million flowed into the stock on the tick-up and $59.64 million flowed out of the stock on the tick-down, for a money net flow of $82.51 million into the stock. Of all equities tracked, Pfizer had the 12th highest net in-flow for the day. Pfizer traded down ($0.08) for the day and closed at $35.89

A number of analysts recently commented on PFE shares. Sanford C. Bernstein set a $43.00 price objective on shares of Pfizer and gave the company a “buy” rating in a research report on Tuesday, January 30th. JPMorgan Chase & Co. restated a “buy” rating on shares of Pfizer in a research report on Tuesday, January 30th. BMO Capital Markets set a $43.00 price objective on shares of Pfizer and gave the company a “buy” rating in a research report on Thursday, February 15th. SunTrust Banks restated a “hold” rating and issued a $40.00 price objective (up previously from $33.00) on shares of Pfizer in a research report on Monday, January 29th. Finally, Zacks Investment Research upgraded shares of Pfizer from a “hold” rating to a “buy” rating and set a $41.00 price objective for the company in a research report on Wednesday, January 24th. Three investment analysts have rated the stock with a sell rating, twelve have issued a hold rating and nine have issued a buy rating to the stock. The company presently has a consensus rating of “Hold” and a consensus price target of $40.08.

Get Pfizer alerts:

The company has a quick ratio of 0.98, a current ratio of 1.27 and a debt-to-equity ratio of 0.45. The firm has a market capitalization of $213.11 billion, a PE ratio of 13.54, a PEG ratio of 1.78 and a beta of 0.89.

Pfizer (NYSE:PFE) last posted its quarterly earnings data on Tuesday, May 1st. The biopharmaceutical company reported $0.77 EPS for the quarter, topping the Zacks’ consensus estimate of $0.74 by $0.03. Pfizer had a net margin of 41.29% and a return on equity of 25.29%. The company had revenue of $12.91 billion during the quarter, compared to the consensus estimate of $13.14 billion. During the same period in the prior year, the business posted $0.69 EPS. The company’s quarterly revenue was up 1.0% on a year-over-year basis. equities analysts expect that Pfizer Inc. will post 2.95 earnings per share for the current year.

The firm also recently disclosed a quarterly dividend, which will be paid on Friday, June 1st. Stockholders of record on Friday, May 11th will be paid a dividend of $0.34 per share. The ex-dividend date is Thursday, May 10th. This represents a $1.36 dividend on an annualized basis and a dividend yield of 3.79%. Pfizer’s dividend payout ratio is 51.32%.

In other news, insider Kirsten Lund-Jurgensen sold 9,510 shares of the stock in a transaction dated Monday, February 26th. The shares were sold at an average price of $37.19, for a total transaction of $353,676.90. Following the completion of the transaction, the insider now directly owns 36,959 shares in the company, valued at approximately $1,374,505.21. The transaction was disclosed in a document filed with the SEC, which is available at this link. Also, CEO Ian C. Read sold 132,312 shares of the stock in a transaction dated Tuesday, May 1st. The stock was sold at an average price of $36.01, for a total transaction of $4,764,555.12. The disclosure for this sale can be found here. Over the last 90 days, insiders have sold 380,349 shares of company stock valued at $13,829,340. Company insiders own 0.06% of the company’s stock.

Several institutional investors have recently bought and sold shares of PFE. Security Asset Management lifted its stake in Pfizer by 6.1% in the 4th quarter. Security Asset Management now owns 22,827 shares of the biopharmaceutical company’s stock valued at $827,000 after purchasing an additional 1,317 shares during the last quarter. Waldron LP lifted its stake in Pfizer by 6.0% in the 4th quarter. Waldron LP now owns 23,785 shares of the biopharmaceutical company’s stock valued at $861,000 after purchasing an additional 1,341 shares during the last quarter. Community Financial Services Group LLC lifted its stake in Pfizer by 0.6% in the 4th quarter. Community Financial Services Group LLC now owns 216,884 shares of the biopharmaceutical company’s stock valued at $7,856,000 after purchasing an additional 1,375 shares during the last quarter. TCI Wealth Advisors Inc. lifted its stake in Pfizer by 2.0% in the 4th quarter. TCI Wealth Advisors Inc. now owns 71,284 shares of the biopharmaceutical company’s stock valued at $2,582,000 after purchasing an additional 1,375 shares during the last quarter. Finally, Banced Corp lifted its stake in Pfizer by 5.4% in the 4th quarter. Banced Corp now owns 26,667 shares of the biopharmaceutical company’s stock valued at $965,000 after purchasing an additional 1,376 shares during the last quarter. Institutional investors own 69.53% of the company’s stock.

Pfizer Company Profile

Pfizer Inc discovers, develops, manufactures, and sells healthcare products worldwide. It operates in two segments, Pfizer Innovative Health (IH) and Pfizer Essential Health (EH). The IH segment focuses on the development and commercialization of medicines and vaccines, and consumer healthcare products in various therapeutic areas, including internal medicine, vaccines, oncology, inflammation and immunology, and rare diseases, as well as consumer healthcare, such as over-the-counter brands comprising dietary supplements, pain management, gastrointestinal, and respiratory and personal care.

Thursday, May 24, 2018

3 Stocks That Feel Like Netflix in 2002

Netflix (NASDAQ:NFLX) filed for its initial public offering 16 years ago. It has gone on to become one of the stock market's most dramatic success stories, soaring from a valuation of less than $500 million in 2002 to over $140 billion today.

It's impossible to know which companies might have a similarly amazing run in them in the coming decades, but three Motley Fool investors see attractive parallels between Netflix in its early days and�iQiyi (NASDAQ:IQ), iRobot (NASDAQ:IRBT), and Crispr Therapeutics (NASDAQ:CRSP)�right now.

What China wants to show you

Dan Caplinger (iQiyi): It wasn't clear back in 2002 what Netflix would eventually evolve into, but the company did have its fingers on the pulse of what consumers wanted from entertainment content: a wide range of available entertainment in an easily deliverable format. At the time, that meant DVDs, but Netflix didn't hesitate to evolve when streaming technology made it a lot more convenient for people to watch the movies and television shows they wanted when they wanted to watch them. Netflix has made big moves to expand internationally, but the huge Chinese market remains a big challenge for foreign companies, and for now, Netflix has focused most of its attention elsewhere.

Now, iQiyi has emerged within China, spun off from internet giant Baidu and offering streaming digital video to Chinese consumers. The business model iQiyi is following isn't as innovative as Netflix's was back in the day, but it's doing a good job of leveraging three different sources of revenue, not only collecting membership fees but also bringing in sales from online advertising and content distribution. With a smart collaborative partnership with e-commerce company JD.com, iQiyi hopes to bring in an even larger number of premium customers, boosting membership revenue and expanding its presence within the digital video space. iQiyi faces more competition than Netflix did in 2002, but the huge Chinese market has enough room for multiple success stories, and iQiyi has gotten off to a good start.

Robots don't get tired

Demitri Kalogeropoulos�(iRobot): Robotic cleaning devices have been around for years, but they're just now starting to see mainstream acceptance. And, as the leading producer in the space, with roughly 60% of the global market share for premium vacuums, iRobot has a good shot at earning impressive sales and profit growth once this niche matures.

A man reclining on a couch as a robotic vacuum cleans the floor.

Image source: Getty Images.

Its most recent results showed off the strength of its brand and its technical lead in the industry. Sales spiked 29% to beat management's forecast thanks to healthy sales of the Roomba vacuum and an encouraging early reception to its new mopping device, called Braava.

As was the case in Netflix's early streaming-video days, there's a wide range of competitors working to establish themselves in the robotic cleaning industry today. And iRobot's long-term profitability will depend on its success at holding off these competitors as it seeks to build scale over the next few years. That's why it makes sense for management to prioritize sales growth over profits right now. Yet if it can keep pushing the industry forward -- like it did last year with innovations such as advanced mapping functionality -- iRobot might be rewarded with a prime position in a much larger industry a decade from now.

A powerful new technology

George Budwell�(Crispr Therapeutics AG): Finding stocks that can produce gains like Netflix is no small feat. However, the gene-editing company Crispr Therapeutics may have what it takes to walk in Netflix's sizable footsteps.�

Crispr is a leader in the latest iteration (and possibly the most powerful form) of gene editing known as Clustered Regularly Interspaced Short Palindromic Repeats, or CRISPR. The quick and dirty version of the story is that this fairly straightforward gene-editing platform may unlock functional cures for perhaps thousands of diseases involving mutations in a single gene. Equally as exciting, this unique approach to gene editing might even be a useful tool in agriculture.�

Two scientists performing clinical research.

Image source: Getty Images.

Where does Crispr stand now? Per the company's first-quarter earnings release, Crispr and its partner Vertex Pharmaceuticals are on�track to initiate a combined phase 1/2 trial to assess the safety and efficacy of autologous gene-edited hematopoietic stem cell therapy�CTX001�in patients with transfusion-dependent beta thalassemia sometime in the second half of 2018. This trial is set to be the first company-sponsored CRISPR-based product candidate to be assessed in human subjects in the United States.�

While it's still early days and there are some concerns that the first generation of CRISPR systems won't pan out in humans, Crispr does have the potential to generate absolutely astonishing returns on capital if CTX001 hits the mark in the clinic. CRISPR, after all, could end up becoming the gold standard in the new era of gene editing that's only now starting to become an integral part of the biopharmaceutical landscape.

Tuesday, May 22, 2018

Robbie Williams to ��Party Like a Russian�� for Rich Elite

“It takes a certain kind of man with a certain reputation, to alleviate the cash from a whole entire nation. Take my loose change and build my own space station. (Just because you can, man.)”

Robbie Williams’s lyrics in the 2016 song "Party Like a Russian" digs at the country’s rich and powerful. This week, it might be their dancing music. The British pop artist is headlining the glitziest after-hours bash at Russia’s annual economic forum this week. The party will celebrate the 25th anniversary of MegaFon PJSC, the wireless company owned by Alisher Usmanov.

Aside from the business agenda, the three-day event in St. Petersburg is known for its lavish late-night parties where Russia’s top brass mingle with celebrities and the champagne flows freely. The economic forum this year will be attended by President Vladimir Putin and French President Emmanuel Macron, and panels include everything from how to do business in Russia to biotechnology and blockchain.

Deripaska’s Absence

Noticeably absent from the forum will be an official delegation from United Co. Rusal, the aluminum giant sanctioned by the U.S. government last month. For the first time in about a decade, the company isn’t sponsoring events or sending a team of executives, according to three people familiar with the situation.

#lazy-img-327939327:before{padding-top:66.68334167083543%;}

Oleg Deripaska

Photographer: Chris Ratcliffe/Bloomberg

Rusal owner Oleg Deripaska will make a final decision this week on whether to go to St. Petersburg, the people said, adding that it’s unlikely he’ll attend.

The company has more pressing issues to deal with. Rusal faces a long list of operational problems, and is currently negotiating an end to the sanctions with the U.S. Treasury. A spokeswoman for Deripaska declined to comment.

An absence would mark the new reality for the aluminum magnate, who prided himself on his reputation as a globe-trotting executive who threw extravagant events. In February, Deripaska’s party in Davos featured Russian folk dancers and a performance by Enrique Iglesias.

Read more: Deripaska’s Fall: From Davos Party King to Outcast in Three Days

LISTEN TO ARTICLE 1:53 Share Share on Facebook Post to Twitter Send as an Email Print

Sunday, May 20, 2018

The strong dollar is a stock-market drag and poses a threat to earnings growth

The U.S. dollar has been on a nearly unstoppable uptrend since the start of the second quarter, rising in tandem with government bond yields, while equities got the short end of the stick.

Now, investors wonder whether a buoyant buck will derail earnings growth.

Since the beginning of April, the ICE U.S. Dollar Index DXY, +0.21% a popular gauge of the U.S. currency that measures it against six rivals, is up 3.9%. Meanwhile, the S&P 500 SPX, -0.26% was off 0.3% and the Nasdaq Composite Index COMP, -0.38% �was down 0.4% over the same period, marking just past the halfway point for the second quarter.

Don��t miss: Bonds, stocks and gold all falling at the same time meant there was almost nowhere to hide

The Dow Jones Industrial Average DJIA, +0.00% �was up 2.5% over the same period, according to FactSet data.

So what gives?

��The lackluster year-to-date performance of equities suggest that strong first quarter results are arguably already reflected in current prices,�� Terry Sandven, chief strategist at U.S. Bank Wealth Management told MarketWatch in emailed comments. ��Among the factors that could temper the pace of earnings growth is a rising dollar.��

The stock market has been troubled by the greenback��s rally, which has in part been thrust higher by rising yields on U.S. government bonds. Those, in turn, represent higher expected interest rates that can be unfavorable to stocks.

Don��t miss: Just 1% of investors expect the economy will be stronger a year from now

In the past week, the 10-year Treasury yield TMUBMUSD10Y, -1.78% rose back above the 3% threshold to hit a seven-year high, leading the dollar higher and causing bouts of pain for equities. The Dow and the Nasdaq faced their biggest daily percentage slump in three weeks. For the S&P it was the worst daily performance since the beginning of the month.

Rising interest rates suggest higher borrowing costs and rising valuations for companies, which is weighing on stocks.

Also check out: Here are the 20 stocks that the biggest hedge funds love most

In the week ahead, the Federal Reserve will release the minutes from its May 1-2 meeting, which could add to the dollar and Treasury yield climb should they sound a hawkish tone. There was no news conference for the Fed��s May meeting, a point that confers more significance on the minutes.

See: Fed is ��one decision away�� from hammering Treasurys, says bond fund manager

��With inflationary pressures being more prevalent, interest rates in the U.S. being on the cusp of a regime change, and apace of global growth appearing less synchronized, conditions are ripe for the U.S. dollar to inch higher in the second half of 2018,�� Sandven said. ��A rising dollar is a headwind to earnings growth and valuations, suggesting that future equity returns are apt to be more subdued.��

The S&P 500, for example, has material exposure to foreign economies and thus their currencies and the inherent currency risk. Companies with foreign earnings are exposed to the exchange rate risk between the U.S. and other countries they��re active in. If the dollar is weak, currencies abroad other foreign currencies perform better and boost earnings abroad for U.S. businesses.

Just like a weak buck led multinational S&P 500 constituents to outperform due to stronger currencies elsewhere in the first quarter of the year, the dollar��s newfound strength may have the reverse effect on second-quarter earnings.

S&P Dow Jones Indices

Read: Here��s the mood in the boardroom after a stellar earnings season

Inherently global sectors, such as materials, financials and energy, tend to suffer particularly from a rising greenback, according to data from S&P Global.

The energy sector, for example, is ��too sensitive to the downward pressure on oil with a strengthening dollar,�� wrote Jodie Gunzberg, managing director and head of U.S. equities at S&P Dow Jones Indices in a blog post.

That said, there is more to the link between the dollar and the energy sector, in particular when it comes to oil, in part because the U.S. is now a net producer of the commodity.

See: Oil and the dollar are doing something they have only done 11 times in the past 35 years

Oil futures CLM8, -0.20% �hit 3 1/2-year highs in the past week, with Brent crude LCON8, -0.74% the global benchmark temporarily trading above the psychologically important $80 level on Thursday.

Check out: Here��s what surging oil prices mean for the stock market

And history offers some comfort. Close to 71% of revenues of S&P 500 companies are generated in the U.S., and looking at the past decade, a rising dollar hasn��t dragged them down.

Read: Why it may be downhill from here for the U.S. dollar

Since 2008, the data show, for every 1% rise in the dollar large-cap companies have gained 71 basis points on average, thanks to their heavier U.S. revenue concentration. Especially consumer staples, health care and utilities were helped by the strong buck.

For midcap and small-cap firms the correlation was even stronger, as those companies tend to generate even more of their revenues in the U.S., on average. And indeed, in the year-to-date small and midcaps have been outperforming, as evidenced by the performance of one measure of small-cap names, the Russel 2000 RUT, +0.08% which has gained 5.9% so far this year and is up 6.3% since the beginning of April.

See: Here��s why small-cap stocks can continue to beat their large-cap peers

Looking ahead

On the data front, the week ahead starts with the Chicago Fed National Activity Index on Monday. Besides the FOMC minutes, the composite flash PMI for May is also due on Wednesday, before weekly jobless claims and home sales data on Thursday. Consumer sentiment and durable goods orders conclude the data run on Friday.

Among Fed speakers, Fed Chairman Jerome Powell is scheduled to address an event in Stockholm on Friday morning Eastern Time.

Ahead of Powell��s speech, investors will hear from Atlanta Fed President Raphael Bostic, Philadelphia Fed President Patrick Harker and Minneapolis Fed President Neel Kashkari on Monday. Harker will speak at a second event on Thursday, with New York Fed President William Dudley also set to deliver remarks that day.

Following Powell��s speech on Friday, Chicago Fed President Charles Evans and Dallas Fed President Rob Kaplan are scheduled to appear on a panel together and Bostic delivers another speech.

Saturday, May 19, 2018

LIC bet on these 10 small & midcap multi-baggers returned up to 1,000% in 1year

Kshitij Anand

India��s biggest domestic institutional investor Life Insurance Corporation (LIC) saw value additions of nearly Rs 14,000 crore to its portfolio even though the number of stocks in its portfolio decreased to 367 from 375 recorded in the December quarter.

Data available with Ace Equity till May 16 shows a list of 10 stocks in LIC��s portfolio that have emerged as multi-baggers in the last one-year. Most of the stocks that have returned 100-1,000 percent in the last one-year belong to the small and midcap space, which recently went through a massive correction.

If comparison, the BSE Midcap Index has plunged a little over 10 percent, followed by a near nine percent fall in the BSE Smallcap Index compared to 3.9 percent rise in the BSE Sensex so far in 2018.

related news Buy or sell: Top stock trading ideas by Hadrien Mendonca, Prakash Gaba Nifty may correct to10,600; Bharti Airtel a great short-term sell

Small and midcap stocks in which LIC holds considerable stake includes: HEG, Graphite India, Lime Chemicals, Bombay Dyeing, Excel Industries, Shalimar Wires, Lakshmi Automatic, Punjab Alkalies, NIIT Technologies and Sterlite Technologies.

table

Most mid- and smallcap stocks that emerged multi-bagger in 2017 came under pressure thanks to mutual fund reclassifications introduced by the market regulator, lofty valuations, rising crude oil prices and a falling rupee to the dollar.

Midcaps have struggled over the last few months, resulting in underperformance versus largecaps. Over the last 12 months, midcaps have underperformed largecaps, but it still trades at a 23 percent premium to the Nifty in terms of P/E, a report said.

A large part of the underperformance in the midcaps space can be attributed to profit-booking, especially after the stellar run seen in 2017. ��Some of these high valuation stocks corrected when markets fell in February and March. Post that correction, some midcaps have started to come into an attractive valuation zone,�� said Jagannadham Thunuguntla, Senior Vice-President and Head of Research (Wealth), Centrum Broking.

Sounding a cautionary note, he said investors should focus on quality companies with strong earnings be it largecaps or midcaps.

We have collated views from various technical experts on stocks which have given stellar returns in the last one-year and what investors should do now if they are holding these stocks:

Analyst: Mazhar Mohammad, Chief Strategist �� Technical Research & Trading Advisory, Chartviewindia.in

HEG: Target Rs5200

After a multi-fold rise from the lows of Rs 150 which it registered in January 2017, this counter appears to have resumed its up move after a multi-month corrective and consolidation phase. In the near-term, the current momentum may take it towards Rs 3,900 kind of levels.

However, a major breakout will occur once this counter settles above Rs 3,900 levels and in such a scenario a new target of Rs 5,200 can be expected. A short-term downtrend can resume only on a close below Rs 3,200 levels.

Graphite India: Target Rs 1,150| Buy on dips

In May 2017 this counter was trading at a low of Rs 107 and thereafter its fortunes turned as it multiplied itself by 9 times before slipping into multi-month corrective and consolidation phase.

After the recent result, this counter appears to have resumed its up move with an initial target of Rs 906 but once it settles above lifetime highs of Rs 906 levels a bigger target of Rs 1,150 can��t be ruled out.

A short-term downtrend in this counter will kick in only on a close below Rs 740. Till then, positional traders can make use of dips to accumulate.

Bombay Dyeing: Target Rs 320

The short-term trend in this counter appears to be somewhat down and the weakness may get accelerated further on a close below Rs 277 levels.

In such a scenario it can target close to 245 kind of levels. Hence, traders are advised to have a tight stop below Rs 277 on a closing basis.

If it manages to sustain above Rs 277 then a modest target of Rs 300 �� 320 can be expected. A major move in this counter is unlikely to happen unless it sustains above Rs 322 levels.

Excel Industries: Target Rs 1,900

After a sporadic rise from the lows of Rs 350 registered in July 2017, this counter appears to have hit intermediate top around Rs 1,463 in April 2018.

Since then, it is trading in a corrective and consolidation phase and weakness may further get accelerated if it slips below Rs 1,212 on a closing basis.

Hence, traders can continue with their existing positions with a stop below Rs 1,200 and look for an initial target of Rs 1,450. This counter may resume its upward momentum on a sustainable close above Rs 1,465 levels. In such a scenario a target close to Rs 1,900 can be expected.

Analyst: Achin Goel, Head of Wealth Management and Financial Planning, Bonanza Portfolio Ltd

Sterlite Technologies Ltd: Target Rs 360

The stock has been consolidating since the inception of the current year with Rs 300 and Rs 400 is the bands. In the recent action, the stock has shown an initial sign of reversal from 310 level. Multiple lows are seen at 310 on the daily chart.

Therefore, Rs 310 is expected to act as crucial support in the near to short-term. The near-term trend in the stock price may remain positive as long as the price sustains above Rs 310.

On the higher end price may extend its northward movement till Rs 350 - 360. Chances of more upsides will come into the picture once price settles above Rs 360. On the other hand, a breakdown below Rs 300 may push the stock into the bear phase.

NIIT Technologies Ltd: Target Rs 1300

The stock is in a structural uptrend and every correction has been well bought by the participants. Currently, the price has been consolidating after a steep correction.

In this situation accumulation is a good option for the next bull ride in the stock. A fall towards Rs 1,000-970 should be utilized as a buying opportunity.

On the lower end, 950-900 bands are expected to act as crucial support. A slip below Rs 900 could result in the stock losing its uptrend and will enter in a larger degree consolidation. On the higher end, we may lock our expectations for Rs 1,300-1,400 levels.

Punjab Alkalies: Target Rs 59

The stock has witnessed a spectacular rally since early March this year. Currently, the stock is in a short-term consolidation phase. In the current trend, the stock price may dip towards 37-35.

The trader may place a tight stop loss below 35, and a decisive fall below 35 may take the stock weaker zone. On the other hand, if the stock manages to stay afloat above 35 we may see solid rebound in the price.

In that case, the traders may expect a movement which may take the price towards 56-59.

Lakshmi Automatic Loom: Keep a stop below Rs 50

The stock had witnessed a steep rally from 50 to 68.55, and since then it has been in a downwards consolidation. Currently, the stock has been trading in the middle of the range.

Going forward, the bands on either side will act as a magnet. The magnetic pull may direct the stock price towards the poles (50/70).

Traders are expected to lock their loss at 50, because if it slips below 50 then the stock price may lose its shine and fall into bear phase. On the other hand, Rs 70 would be level above stock price may up move up quickly towards Rs 90.

Shalimar Wires Industries: Crucial support at Rs 16

The stock is in short term downtrend, which may come to a halt at 16. A recovery in the stock may happen if it sustains above the said level.

The rebound may take the price towards 22. Again, a sustained trade above Rs 22 may set a new rally towards Rs 27. However, if the fall doesn't get arrested at 16, we may see a bigger correction in the stock price.

Disclaimer: The views and investment tips expressed by investment experts on moneycontrol.com are their own and not that of the website or its management. Moneycontrol.com advises users to check with certified experts before taking any investment decisions.